
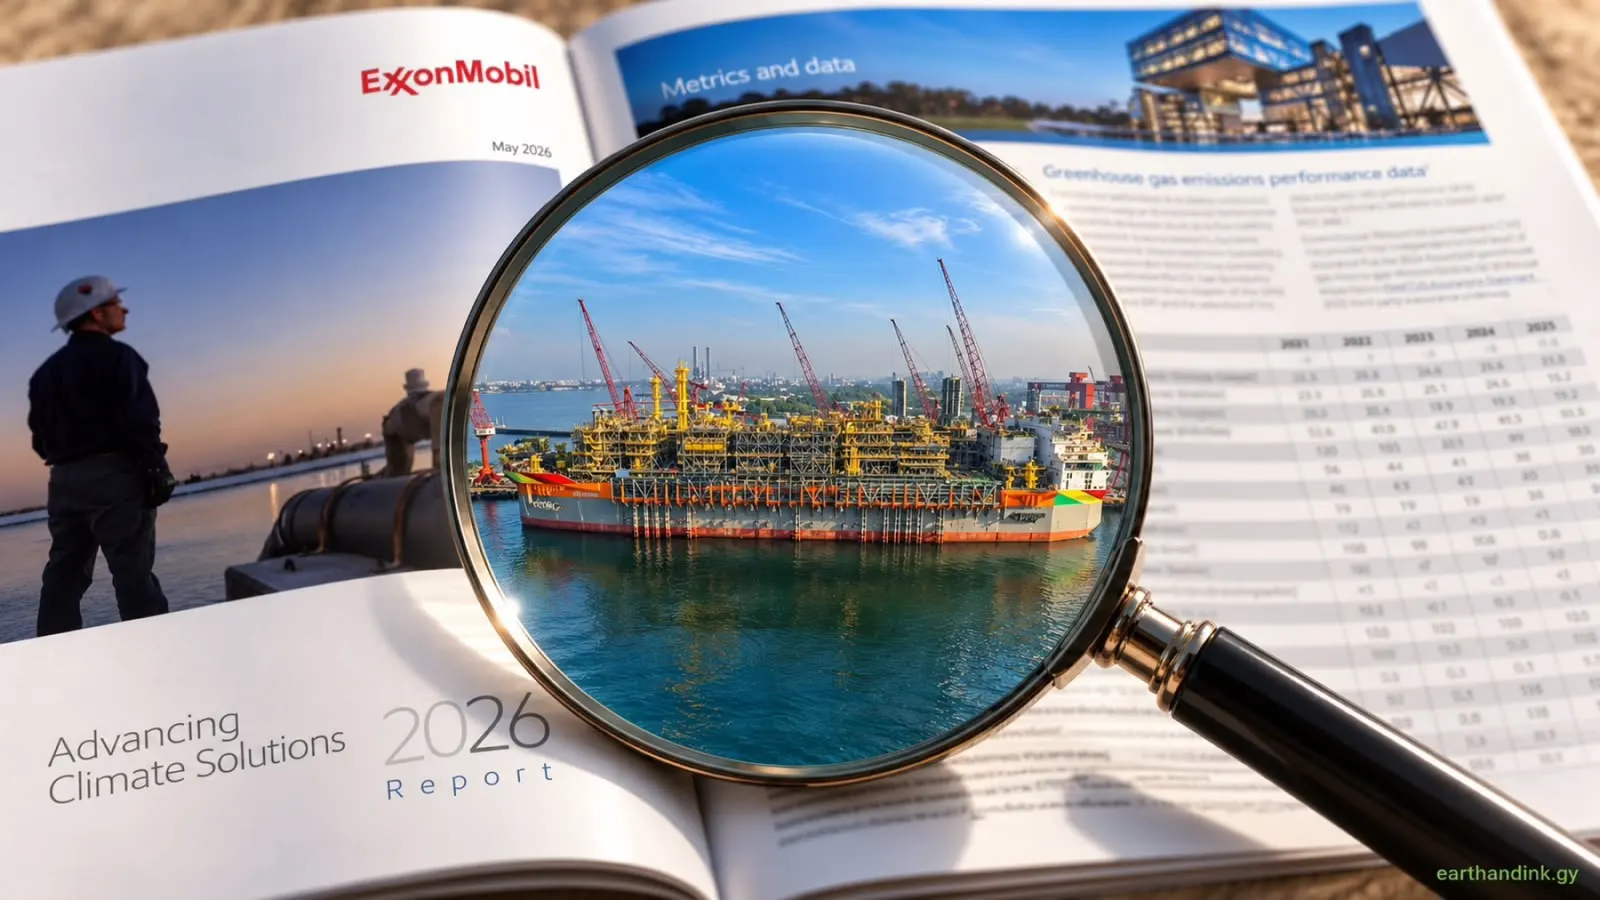
An oil company announces that it is burning less gas across its operations worldwide. It sounds like good news. But does it mean less gas is being burned off Guyana’s coast?
The answer depends on which operations the figures cover. Think of a school reporting better examination results overall: some classes may have improved while others performed worse. A company operating in several countries can similarly report an overall improvement without establishing what happened in each location.
For us, that distinction matters. Company reports contain information about how production is managed, including substances released into the air and water discharged into the sea. Understanding what they tell us about Guyana starts with knowing where the numbers come from, what they measure and what has been independently checked.
Start with where the number comes from
Take flaring, which means burning gas, including gas brought up alongside oil during production. ExxonMobil’s published performance table reports that flaring across its operated assets worldwide fell from 200 million standard cubic feet per day in 2024 to 150 million in 2025. A standard cubic foot measures gas volume under specified conditions. Within its Americas operations, however, the reported figure increased from 70 million to 80 million standard cubic feet per day.
The worldwide total went down while the total for one broad region went up. Neither figure establishes whether flaring increased or decreased in Guyana, because the Americas category covers a wider area and does not separately identify Guyana’s contribution. Applying either trend directly to our offshore operations would go further than those figures allow.
The measurement itself also matters. Oil companies report on emissions, meaning substances released into the air. These can include gases released when fuel is burned or gas escapes from equipment. Some figures describe the total amount released, while others describe emissions intensity: the amount released relative to production or another measure of activity.
Consider a hypothetical operation producing 100 barrels of oil and releasing 100 units of emissions. That is one unit per barrel. The following year, it produces 200 barrels and releases 150 units. Emissions per barrel have fallen to 0.75 units, but the total released has increased by 50%.
The operation has become more efficient while releasing more overall. Both measures are useful, and reading them together gives us a fuller understanding of performance.
A daily check is different from its result
ExxonMobil Guyana’s 2024 Annual Report provides a local example involving produced water, which is water brought up from underground reservoirs alongside oil. The company says this water undergoes several treatment stages aboard its floating production, storage and offloading vessels, commonly called FPSOs. These vessels process and store oil offshore before it is transferred for transport.
According to the report, the water is discharged only after its oil content has been reduced below prescribed regulatory limits, meaning the limits set by the relevant authorities. The company also describes daily sampling of the discharge stream to check treatment effectiveness. This explains the treatment and monitoring process ExxonMobil Guyana says it follows.
Understanding performance requires examining what those checks recorded. Much as daily blood pressure checks establish a monitoring routine while the readings show a person’s condition, daily water sampling establishes how often testing occurs while the results show what was found.
An assessment would therefore examine the sample results alongside the volume of water discharged, any measurements above the applicable limits and any action taken to correct a problem. The annual report’s description of daily sampling does not, by itself, provide that full assessment.
Other public documents explain what was anticipated before operations began. Guyana’s Environmental Protection Agency publishes impact assessments for developments including Liza Phase 2, Payara, Yellowtail, Uaru, Whiptail and Hammerhead. An impact assessment examines how a proposed project could affect its surroundings and identifies measures intended to prevent or reduce harm.
These assessments explain anticipated risks and proposed safeguards. Operational monitoring records help establish what subsequently occurred. Reading both allows us to connect what was planned with what was recorded during production.
What independent verification covers
Some company information is examined by an outside organisation through an assurance engagement, a formal process for checking specified information against stated criteria. The accompanying assurance statement identifies what was examined, the period covered and the extent of the checking.
The ERM Certification & Verification Services statement linked from ExxonMobil’s reporting page covers selected 2024 greenhouse gas information presented in its 2026 Advancing Climate Solutions Report. Greenhouse gases trap heat in the atmosphere; examples include carbon dioxide and methane. The selected information includes specified emissions, methane and flaring figures.
ERM CVS provided “limited assurance”, explaining that its procedures were less extensive than those required for a higher level known as “reasonable assurance”. Its conclusion concerned whether the selected information was fairly presented under the stated reporting criteria.That conclusion applies to the information identified in the statement, rather than every claim in the report or every condition of a Guyana project’s permit.
The dates also deserve attention. A report published in 2026 can contain figures from earlier years, while an independent check may cover only one of those years. As of 22 October 2026, ExxonMobil’s public metrics page continued to state that third party assurance of its 2025 data was underway. This was the status displayed on the page reviewed for this article.
Reading with context
The purpose of a report helps to explain what it contains. A worldwide performance table summarises activity across many operations. A Guyana annual report provides a local account of the company’s activities, while an impact assessment examines a proposed project and an assurance statement explains which information an independent reviewer checked. Each can be useful without answering every question a reader might have.
The examples in this article illustrate those differences. The global and Americas flaring figures cannot establish Guyana’s trend on their own. A description of daily water sampling explains a monitoring process; the results are needed to assess the facility’s performance. These limits do not, by themselves, show that a company has been dishonest or that its operations have failed to meet the required standards. They define what we can reasonably conclude from the particular information being read for the applicable context.
As readers, we need to consider both the information and the purpose for which it was presented. Before accepting a headline as a conclusion about Guyana, we should establish the operations and period covered, the meaning of the measurement and the extent of any independent checking. We should also distinguish a company’s stated aim, its description of the associated management process and its reported results. Each tells us something different.
This approach allows us to recognise progress where the evidence supports it and to identify when more specific information is needed. A regional figure cannot establish local success or failure, and a question left unanswered by one report is a reason to consult the relevant records rather than assume the report is misleading. For Guyana, informed scrutiny means understanding what the evidence establishes before deciding what it means for our country.